How Many Natural Gas Plants Are in Texas
3 minute readHow many natural gas plants operate in Texas? How many more are proposed amid surging energy demand?
Home > Learning Center > How the Energy Industry Works > How Global Politics Impact Natural Gas Energy Prices
7 minute read • Last update July 2025

With so much happening in the world, you may be curious about how global events are impacting your household’s utility bills. Let’s look at how U.S. natural gas prices fit into the bigger picture.
The U.S. leads the world in natural gas production, outpacing Russia and Iran.
In 2022, utility-scale electricity generation facilities in the U.S. generated about 4,243 trillion kilowatt hours of electricity. Around 60% derived from fossil fuels, 18% from nuclear energy, and 22% from renewable energy sources.
Due to higher population densities, European countries have always had to import more energy than the U.S. The total land area of the U.S. is over twice that of the European Union, yet the total population is less than two-thirds. Compared to the 4.24TWh of energy that the U.S. produces annually, European countries produce just 2.78TWh of power cumulatively.
Texas leads the charge in natural gas production in the U.S., producing nearly 25% of America’s natural gas in 2021.
Events that impact natural gas prices for the consumer can be broken down into three main categories: political, natural and operational.
Like any other fuel, natural gas price projections fluctuate due to global events, and gas price predictions rise and fall in line with demand.
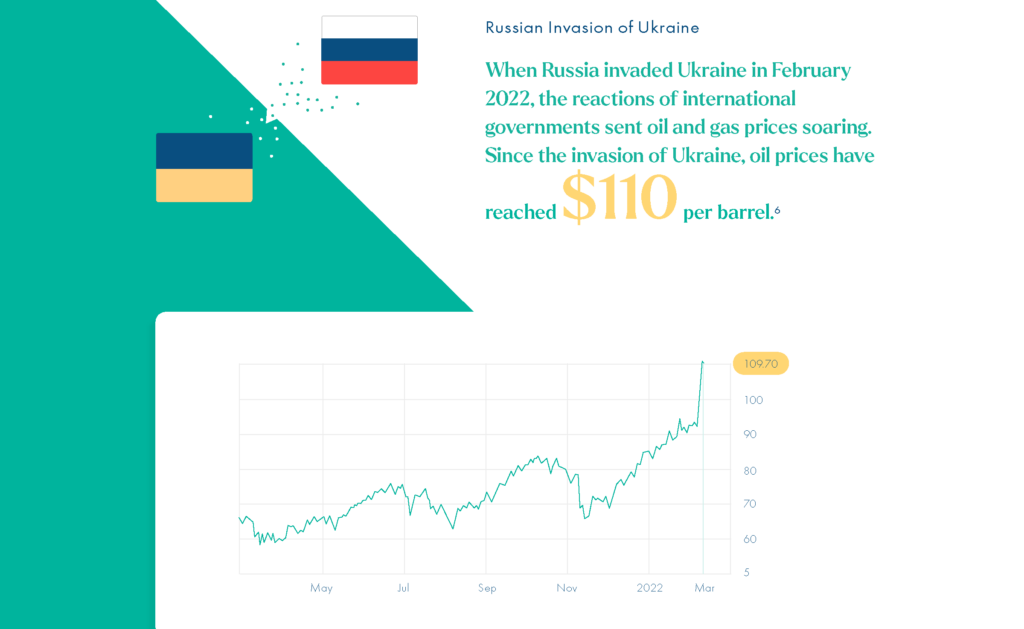
When Russia invaded Ukraine in February 2022, the reactions of international governments sent oil and gas prices soaring. Since the invasion of Ukraine, oil prices have reached $110 per barrel.
President Biden signed an executive order banning imports of Russian oil, natural gas, and coal. Since then, American crude oil imports have been down 760,000 barrels per day from 2021’s average of 6.1 million barrels per day. Several European nations followed suit, meaning shipments of hydrocarbons previously consumed by European and American markets were rerouted to Asia.
EU countries increased gas reserves in 2022 to ensure sufficient supply for European residents. A regulation was adopted in June 2022 to fill storage facilities to at least 80% of their capacity prior to winter months and 90% for consecutive winter months. Even after the cold season, storage levels in March 2023 hovered around 55% — significantly higher than the average storage levels of 26% in April 2022.
Expanding energy storage facilities has been vital in times when supply is not as reliable, given the sharp decrease in fossil fuel availability from Russian suppliers. Common solutions like storing power in lithium batteries or hydropower reservoirs have several drawbacks, ranging from environmental impact to limited lifespan. As a result, European storage facilities have been struggling to find innovative ways to store cleaner energy and ensure a consistent supply.
The surge in liquefied natural gas (LNG) cargoes and pipeline exports, coupled with low natural gas inventory and heightened demand, have led to widespread supply chain disruptions in key energy-dependent markets, such as steel production, food processing, and fertilizer manufacturing. Despite the uptick in American dry natural gas production, it wasn’t quick enough to offset the impact. The effect on natural gas economics? The price per therm (one therm = 100 cubic feet of natural gas) doubled between February and October 2022.
Many countries have been heavily investing in cleaner energy. The global investment in renewable energy in 2022 reached a record-high of $1.3 trillion, up 19% from 2021 and 70% from 2019. And for good reason — the fastest way to achieve decarbonization goals and simultaneously avert energy shortages is to phase out coal and petroleum fuels and replace them with cleaner solutions like wind, solar power, and hydro power. Natural gas is a cleaner-burning fuel that helps provide around-the-clock energy to supplement renewables, and renewable energy investments on state and local levels can lead to lower electricity costs.
Local and environmental events also impact natural gas prices, such as inclement weather and natural disasters.
Natural disasters like hurricanes, flooding, and fires have an impact on natural gas prices. Rises in natural gas prices during these periods can be the result of disrupted production, extended outages, logistics issues, damaged infrastructure, and price gouging. For example, Hurricanes Katrina and Rita affected prices when they disrupted natural gas production in the Gulf of Mexico in 2005. However, disruptions in this region tend to have a lower impact on prices today due the decline in total percentage share of U.S. dry natural gas production from 25% in 2001 to 2% in 2021.
Inclement weather can impact gas prices significantly. In times of exceptionally high demand, when suppliers are affected by elevated operational costs, consumer prices soar. For example, a repeat of the Texas winter storm of 2021 would see prices skyrocket as temperatures plummet.
Natural gas prices are determined by a variety of operational costs, which are ultimately passed on to the consumer.
Around 100 countries produce crude oil, yet five countries account for 51% of total production. America is one of the world’s largest producers, along with Russia, Saudi Arabia, Canada, and Iraq. The U.S. alone accounts for around 15% of global crude oil production.
Price movements in the crude oil economy undoubtedly affect the natural gas price per therm forecast. The correlation coefficient between crude oil and natural gas is 0.25, meaning a change in oil price can affect natural gas price projections by 25%.
Before it can be used, energy must be harvested and refined to make it safe for transportation and consumption. The complexity of the processes and associated cost for the supplier is passed directly onto consumers.
In many countries (including the U.S.), excise tax on fuel is the only specific energy tax. However, many governments offer tax incentives to encourage and promote the production of cleaner, greener energy that address the environmental impacts of fossil fuel consumption.
Sales, marketing, and distribution costs account for a significant chunk of energy bills and fluctuate as these factors change. Fossil fuels like petroleum, oil, and coal, are costly to move around compared to natural gas and renewable energy.
The U.S. may be one of the giants of crude oil, but we also lead the way in natural gas. Dry gas production is expected to reach 100.34 billion cubic feet daily in 2023. The abundance of natural gas in the U.S. means that 92% of natural gas consumed in the United States is produced domestically.
Several countries import natural gas from the U.S. In fact, U.S. suppliers have helped fill the gap in natural gas production in Europe, with the E.U. natural gas import dependency rate at 83%. The White House continues to increase exports of liquefied natural gas to aid E.U. countries attempting to diminish dependence on Russian fossil fuels.
European shipments of American LNG increased 137% YOY in the first 11 months of 2022, accounting for more than half of Europe’s LNG imports. The U.S. looks set to remain Europe’s top seller in 2023, as exporters have greater volumes of surplus gas available than other major exporters like Qatar.
Regarding natural gas prices, predictions based on the abundance in the U.S. market make it an increasingly affordable option for consumers. Before we delve into gas price trend forecasts for your utility bills, let’s first look at how things have changed over the years.
As you can see from this nat gas chart, historical prices were much higher than today. Price points were particularly volatile in 2022, primarily due to European market dynamics. Natural gas price per therm forecasts have now dropped to an 18-month low, making it an ideal time for consumers to switch to natural gas energy.
The low cost of producing stable natural gas and its ability to be safely stored and easily distributed makes it a reliable source of energy to provide round-the-clock power.
What does all this mean for you as a consumer? Let’s look at some of the main factors that will impact the average natural gas price forecast for your home.
Natural gas economics follow the same rules of supply and demand as any other market. Higher supply results in lower prices and a decrease in supply leads to higher prices. Likewise, increases in demand result in higher prices, and decreases in demand lead to lower prices.
The natural gas curve in 2023 results from less consumption than anticipated. During 2023 Q1, consumption has been estimated to average 99.1 billion cubic feet per day, a drop of 5% from 2022 Q4.
The resulting surplus has driven down consumer prices. As of the end of March, U.S. natural gas reserves are expected to house more than 1.9 trillion cubic feet, 23% more than the five-year average.
International natural gas production, net imports, and storage inventory levels can affect domestic natural gas prices. The higher availability is overall, the lower the price will be. Likewise, global deficiencies push the price up for everyone.
Inclement weather can significantly impact natural gas price projections. Consumers pay more during extreme weather when demand pushes up prices. Price spikes are common during harsh winters, heatwaves, and when storms, hurricanes, or floods put pressure on resources.
The demand for natural gas is impacted not only by the general market economics of supply and demand, but by fluctuations throughout each day and season.
Demand is generally highest during the summer due to heavy air-conditioning use. Demand is generally not as high in winter unless there’s a particularly harsh freeze (like the “Oakpocalypse” of February 2023). Demand is lowest during spring and autumn when there is less need for heating or cooling.
Regardless of the season, there are still peaks every morning and evening.
Global events and their impact on natural gas prices can feel daunting, but with Texas as the #1 natural gas producer in the country, consumers can rest easy. Natural gas is the best fit for a reliable transition toward sustainable energy production and the best energy choice for net-zero ambitions. It’s easier and cheaper to capture, cleaner than other alternatives, and produces fewer harmful emissions.
BKV has been safely producing cleaner-burning natural gas since 2015, and has invested in upgrading their high-efficiency, low-emissions power plant to be more environmentally sustainable and winterized for harsh weather.
At BKV Energy, we offer straightforward and simple energy plans with a 30-day risk-free trial, during which customers can cancel for any reason with no termination fee. Continue your net-zero journey today by visiting the BKV website to access more information and educational resources.
Did you find this infographic interesting? Please share it! The code to embed the image on your website is below:
<a title="How Global Politics Impact US Natural Gas Energy Prices" href="https://bkvenergy.com/blog/how-global-politics-impact-natural-gas-energy-prices/"><img style="width: : 98%;" alt="How Global Politics Impact US Natural Gas Energy Prices" src="https://bkvenergy.com/wp-content/uploads/2023/06/BKV_Infographic_The-Global-Economy-Impact-_FINAL_Hi-res.png"/></a>
Javier Hinojosa, Vice President of Retail Power at BKV Energy, has over fifteen years of management experience in M&A, consulting, supply chain, technology, and operations. He is responsible for overseeing all aspects of BKV Energy's business, from finance and brand development to customer service and go-to-market strategy.

How many natural gas plants operate in Texas? How many more are proposed amid surging energy demand?

What is natural gas? As the world continues to seek cleaner and more sustainable energy sources, natural gas has emerged
Get $50 off your electric bill!
Use code BKVEJOINUS50
Enter your zip code to shop BKV Energy's affordable, fixed-rate Texas electricity plans. Use the promo code for $50 off your electric bill.